import for all occasions

We’re making it easier and more fun to get all of your research into ImpactStory.

Do you have a lot of research at figshare?  Great, just point us to your figshare account!  Or maybe you’ve pulled in coding projects through your Github account.

Starting today, you can also add products from these hosts individually, like datasets you’ve co-authored, or repositories you’ve contributed to.

Just click on the GitHub, figshare, or SlideShare importer tiles and point us to an account, a list of individual products, or both:


Have fun pulling in all of your research products!

Do you have thoughts about other ways it could be easier to get your products into ImpactStory?  We want to hear them!  Suggest and vote at http://feedback.impactstory.org!

Update: We’ve made it even easier to import individual GitHub repositories alongside other individual products you want added to your profile. Check out the Knowledge Base to learn more.

Link your figshare and ImpactStory accounts

We’re big fans of figshare at ImpactStory: it’s one of a growing number of great ways to get research data into the open, where others can build on it.

So we’re excited today to announce figshare account integration in ImpactStory! All you have to do is paste in a figshare account URL; then, in the background, we gather your figshare datasets and report their views, downloads, tweets, and more.

The best part is that you’ll see not just numbers, but your relative impacts compared to the rest of figshare. For instance, here’s a figshare product with 40 views, putting it in at least the 67th percentile compared to other figshare datasets that year.  Here’s an even better one: not only is it in the 97th percentile of views, it’s also been downloaded and tweeted.

If you’ve already got an ImpactStory profile, just click “import products” to add your figshare account (you can also still paste individual DOI’s in the “Dataset DOIs” importer). If you don’t have an ImpactStory account yet, now’s a great time to make one–you can be checking out your figshare impacts in less than five minutes.

figshare’s tagline encourages you to “get credit for all your research.” We think that’s a great idea, and we’re excited about making it easier with ImpactStory.

New ImpactStory release: better sign-up, easier importing

Head over to your profile on ImpactStory and have a look around — we’ve made some cool updates!

Today’s release includes a smoother sign-up flow for new users, an easy and graphical way to add products to your existing profile, support for more types of research products (Your twitter account!  Your blog on WordPress.com!), and a cleaner profile page.

Check it out, give us feedback, and stay tuned.  We’re super excited because this release is a major update behind the scenes (for our nerdy readers: a rewrite into angular.js) — the stage is set for awesome features in the days, weeks, and months ahead.

add videos to your ImpactStory profile!

Scientists make videos.  For lots of reasons: to document our protocols, tell the public about our results, raise money, and sometimes just to make fun of ourselvesyoutube

Who’s interacting with the videos we make?  How many people are watching, sharing, discussing, and even citing them in scientific papers?vimeo

You can find out — you can now add your YouTube and Vimeo video research products to your ImpactStory profile!  To add a video to your profile, paste the urls to the videos (ie http://www.youtube.com/watch?v=d39DL4ed754 or http://vimeo.com/48605764) into the “Product IDs” box when you create a profile, or click the Add Products button on an existing profile.

Behind the scenes, ImpactStory scours the web and gathers data from the video hosting sites and other providers.  Here’s an example that has some video views, some ‘likes’, a tweet, and a citation in a PLOS paper:

ANio2gm

Got videos?  Try it out!

ps We’ve got a few more favorite silly science videos that we’ll add in the comments.  Join us — add your favourites in the comments too : )

new release: ImpactStory Profiles

Your scholarship makes an impact. But if you’re like most of us, that impact isn’t showing up on your publication list. We think that’s broken. Why can’t your online publication list share the full story of your impact?

Today we announce the beginning of a solution: ImpactStory Profiles.  Researchers can create and share their impact profiles online under a custom URL, creating an altmetrics-powered CV.  For example, http://impactstory.org/CarlBoettiger leads to the impact profile page below:

http://impactstory.org/CarlBoettiger

 http://impactstory.org/CarlBoettiger

We’re still in the early stages of our ImpactStory Profile plans, and we’re excited about what’s coming.  Now’s a great time to claim your URL —  head over and make an impact profile.

And as always, we’d love to hear your feedback: tell us what you think (tweet us at @impactstory or write through the support forum), and spread the word.

Also in this release:

  • improved import through ORCID
  • improved login system
  • lovely new look and feel!

Thanks, and stay tuned… lots of exciting profile features in store in the coming months!

Uncovering the impact of software

Academics — and others — increasingly write software.  And we increasingly host it on GitHub.  How can we uncover the impact our software has made, learn from it, and communicate this to people who evaluate our work?

Screen Shot 2013-01-18 at 5.56.20 AM

GitHub itself gets us off to a great start.  GitHub users can “star” repositories they like, and GitHub displays how many people have forked a given software project — started a new project based on the code.  Both are valuable metrics of interest, and great places to start qualitatively exploring who is interested in the project and what they’ve used it for.

What about impact beyond GitHub?  GitHub repositories are discussed on Twitter and Facebook.  For example, the GitHub link to the popular jquery library has been tweeted 556 times and liked on Facebook 24 times (and received 18k stars and almost 3k forks).

Is that a lot?  Yes!  It is one of the runaway successes on GitHub.

How much attention does an average GitHub project receive? We want to know, to give reference points for the impact numbers we report.  Archive.org to the rescue! Archive.org posted a list of all GitHub repositories active in December 2012.  We just wanted a random sample of these, so we wrote some quick code to pull random repos from this list, grouped by year the repo was created on GitHub.

Here is our reference set of 100 random GitHub repositories created in 2011.  Based on this, we’ve calculated that receiving 3 stars puts you in the top 20% of all GitHub repos created in 2011, and 7 stars puts you in the top 10%.  Only a few of the 100 repositories were tweeted, so getting a tweet puts you in the top 15% of repositories.

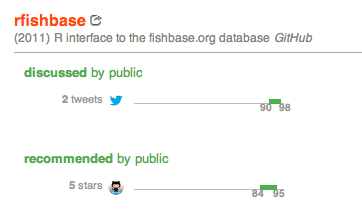
You can see this reference set in action on this example, rfishbase, a GitHub repository by rOpenSci that provides an R interface to the fishbase.org database:

Screen Shot 2013-01-18 at 5.31.49 AM

So at this point we’ve got recognition within GitHub and social media mentions, but what about contribution to the academic literature?  Have other people used the software in research?

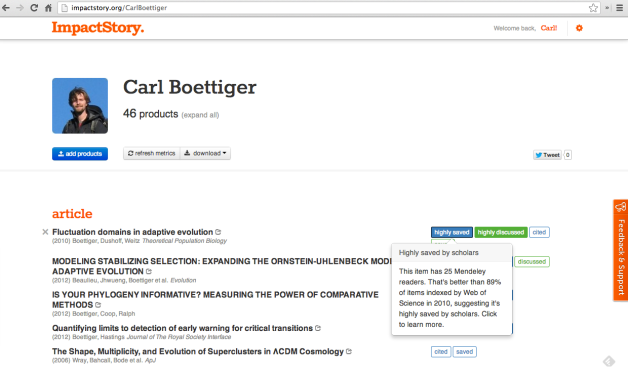
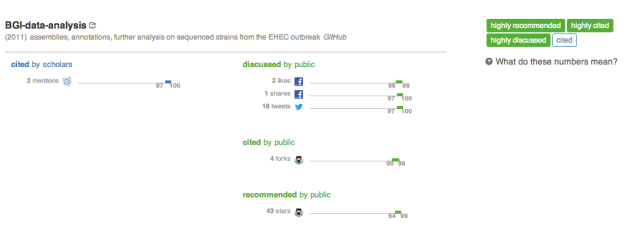
Software use has been frustratingly hard to track for academic software developers, because there are poor standards and norms for citing software as a standalone product in reference lists, and citation databases rarely index these citations even when they exist.  Luckily, publishers and others are beginning to build interfaces that let us query for URLs mentioned within full text of research papers… all of a sudden, we can discover attribution links to software packages that are hidden in not only in reference lists, but also methods sections and acknowledgements!  For example, the GitHub url for a crowdsourced repo on an E Coli outbreak has been mentioned in the full text of two PLOS papers, as discovered on ImpactStory:

Screen Shot 2013-01-18 at 4.45.11 AM

There is still a lot of work for us all to do.  How can we tell the difference between 10  labmates starring a software repo and 10 unknown admirers?  How can we pull in second-order impact, to understand how important the software has been to the research paper, and how impactful the research paper was?

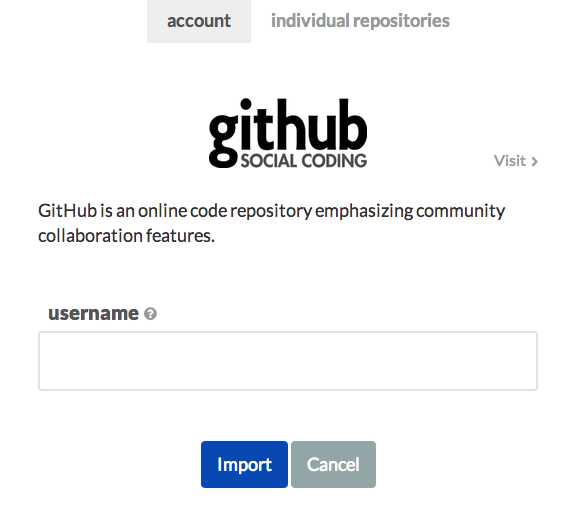
Early days, but we are on the way.  Type in your github username and see what we find!

New widget and API

One of our core goals at ImpactStory has always been to make altmetrics data open and accessible–to help it flow like water amongst providers, applications and platforms. We’re excited today to be announcing two new features pushing us further toward that goal.

First, we’re relaunching our embeddable widget, which shows ImpactStory badges right next to your content. This new version reflects months of coding, testing, and–most importantly–talking to users. It’s lighter, faster, and more robust. You can also embed multiple widgets per page, making it perfect for online CVs or other product lists.

The widget is also way more customizable: you can control size, logo, layout, and other display characteristics. We’ll be rolling out even more display options in the next few weeks, so stay tuned.

Along with the new widget, we’re also formally releasing Version 1 of our REST API. We’ve been testing this for several weeks now with some of our partners including the recently launched eLife. The new version adds some convenience methods and prunes some unused ones. It also comes with improved documentation at Apiary.io. We love that Apiary lets you see examples of API calls in multiple languages, and even run them right there.

As part of announcing v1, we’re also now announcing that the v0 API is deprecated, and will not be supported after  January 1. Let us know if you have any questions or need help moving to the new v1; most of the calls are the same, so should just take a few minutes.

We’d love to have your feedback on both the widget and v1 API. To take either one for a test spin, just drop by our documentation page and request a free API key. And if you’re not already, follow @ImpactStory on Twitter for real-time updates and downtime reports.

Update: we’re no longer offering API keys; the API has been deprecated and turned off. We hope to offer an API again in the near future, one that’s more fully spec’ed out.

ImpactStory from your ORCID ID!

Did you hear?  ORCID is now live!

ORCID is an international, interdisciplinary, open, nonprofit initiative to address author name disambiguation.  Anyone can register for an ORCID ID, then associate their publications with their record using CrossRef and Scopus importers.  This community system of researcher IDs promises to streamline funding and scholarly communication.

ImpactStory is an enthusiastic ORCID Launch Partner.  Once your publications are associated with an ORCID record, it is very easy to pull them into an ImpactStory report:

A few details:

  • ImpactStory only imports public publications. If your Works are currently listed in your ORCID profile as “limited” or “private”, you can change them to “public” on your ORCID Works update page.
  • We currently only import Works with dois — stay tuned, we’ll support more work types soon!

Sound good?  Go register for an ORCID ID now and give it a spin!

A new framework for altmetrics

At total-impact, we love data. So we get a lot of it, and we show a lot of it, like this:


There’s plenty of data here. But we’re missing another thing we love: stories supported by data. The Wall Of Numbers approach tells much, but reveals little.

One way to fix this is to Use Math to condense all of this information into just one, easy-to-understand number. Although this approach has been popular, we think it’s a huge mistake. We are not in the business of assigning relative values to different metrics; the whole point of altmetrics is that depending on the story you’re interested in, they’re all valuable.

So we (and from what they tell us, our users) just want to make those stories more obvious—to connect the metrics with the story they tell. To do that,  we suggest categorizing metrics along two axis: engagement type and audience. This gives us a handy little table:

Now we can make way more sense of the metrics we’re seeing. “I’m being discussed by the public” means a lot more than “I seem to have many blogs, some twitter, and ton of Facebook likes.” We can still show all the data (yay!) in each cell—but we can also present context that gives it meaning.

Of course, that context is always going to involve an element of subjectivity. I’m sure some people will disagree about elements of this table. We categorized tweets as public, but some tweets are certainly from scholars. Sometimes scholars download html, and sometimes the public downloads PDFs.

Those are good points, and there are plenty more. We’re excited to hear them, and we’re excited to modify this based on user feedback. But we’re also excited about the power of this framework to help people understand and engage with metrics. We think it’ll be essential as we grow altmetrics from a source of numbers into a source of data-supported stories that inform real decisions.

Learning from our mistakes: fixing bad data

Total-impact is in early beta.  We’re releasing early and often in this rapid-push stage, which means that we (and our awesome early-adopting users!) are finding some bugs.

As a result of early code, a bit of bad data had made it into our total-impact database.  It affected only a few items, but even a few is too many.  We’ve traced it to a few issues:

  • our wikipedia code called the wikipedia api with the wrong type of quotes, in some cases returning partial matches
  • when pubmed can’t find a doi and the doi contains periods, it turns out that the pubmed api breaks the doi into pieces and tries to match any of the pieces.  Our code didn’t check for this.
  • a few DOIs were entered with null and escape characters that we didn’t handle properly

We’ve fixed these and redoubled our unit tests to find these sorts of bugs earlier in the future…. but how to purge the bad data currently in the database?

Turns out that the data architecture we had been using didn’t make this easy.   A bad pubmed ID propagated through our collected data in ways that were hard for us to trace.  Arg!  We’ve learned from this, and taken a few steps:

  • deleted the problematic Wikipedia data
  • deleted all the previously collected PubMed Central citation counts and F1000 notes
  • deleted 56 items from collections because we couldn’t rederive the original input string
  • updated our data model to capture provenance information so this doesn’t happen again!

What does this mean for a total-impact user?  You may notice fewer Wikipedia and PubMed Central counts than you saw last week if you revisit an old collection.  Click the “update” button at the top of a collection and accurate data will be re-collected.

It goes without saying: we are committed to bringing you Accurate Data (and radical transparency on both our successes and our mistakes 🙂 ).